Trace Viewer#
slime can attach lightweight execution traces to each rollout sample. These traces capture span-style events such as generation and reward-model calls, and they can be inspected later from a saved rollout debug dump.
Save rollout trace data#
To inspect traces later, save rollout debug data during a run:
python train.py \
    ... \
    --save-debug-rollout-data /path/to/debug/rollout_{rollout_id}.pt
Each saved .pt file contains the rollout samples together with their trace payloads. You can also replay the same dump later with --load-debug-rollout-data.
Open the timeline viewer#
Use the trace viewer script on a saved rollout dump:
python tools/trace_timeline_viewer.py /path/to/debug/rollout_0.pt
The script generates:
rollout_0.trace_timeline_cache.jsonrollout_0.trace_timeline_viewer.html
By default it also starts a local static server so you can open the generated HTML immediately. If you only want the files, use --no-serve.
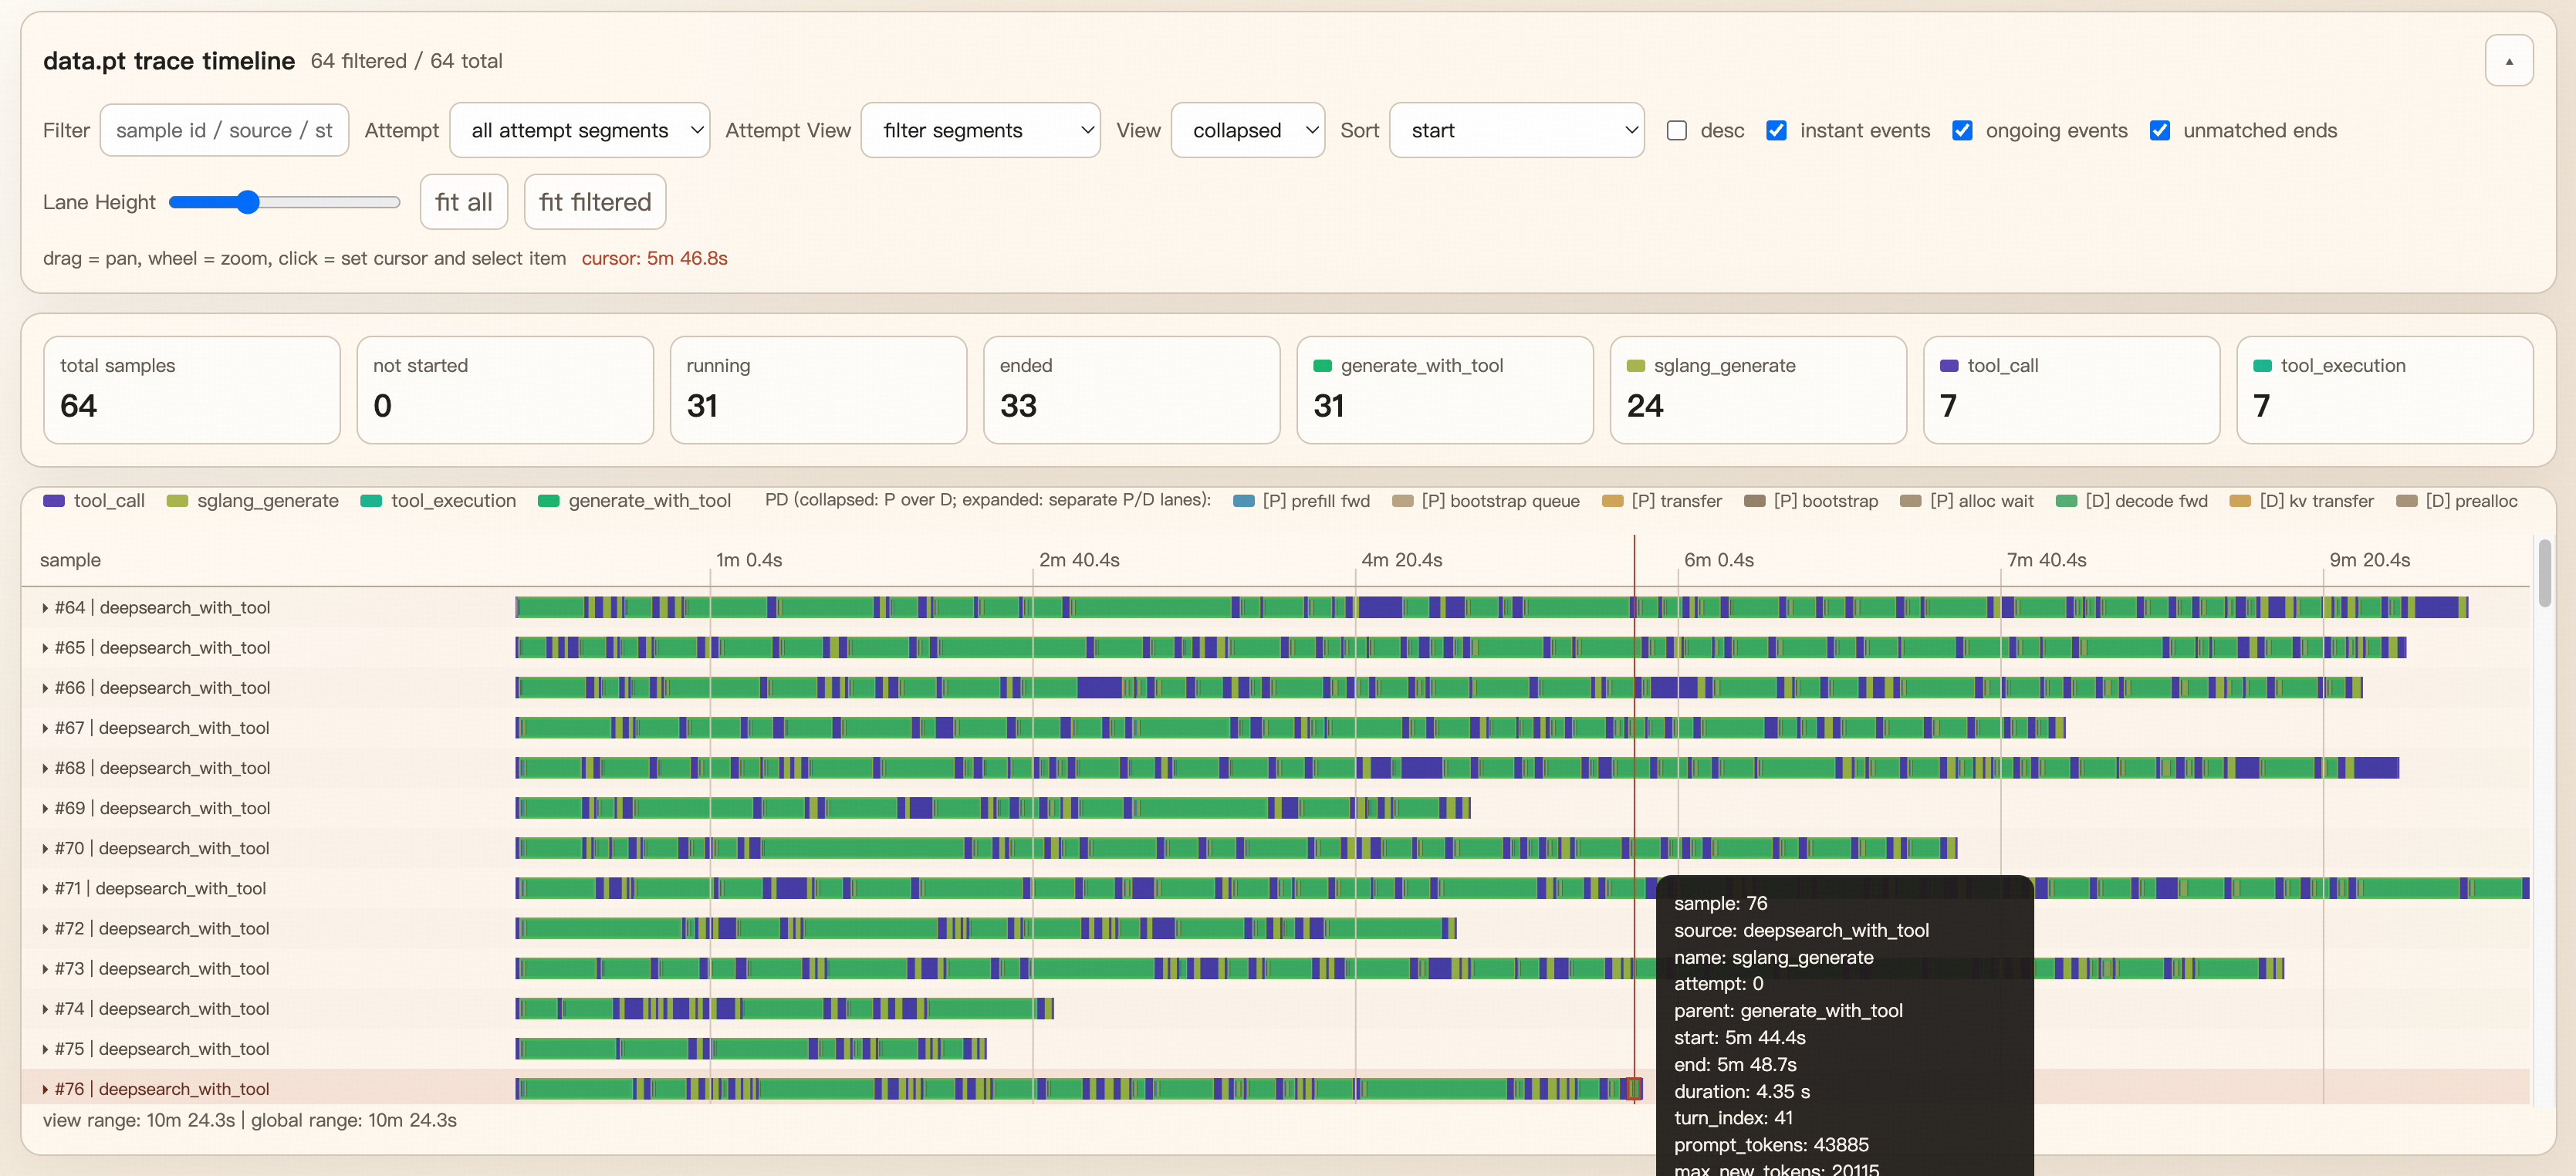
How to read the viewer#
Each row corresponds to one sample.
Bars represent spans, while point markers represent instant events.
Span attributes recorded at the start or end of
trace_span(...)are shown in the details panel.When SGLang returns PD disaggregation timings, the viewer adds synthetic
[P]and[D]lanes to break out prefill/decode work.When PD is not enabled, those virtual lanes are omitted automatically and the base trace still renders normally.
Instrument custom code#
For custom rollout or reward code — including custom agent steps, tool calls, sandbox execution, and verifier calls in agentic workflows — reuse helpers from slime.utils.trace_utils:
trace_span(target, name, attrs=...): record a duration span.trace_event(target, name, attrs=...): record an instant event.trace_function(name, ...): wrap a whole sync/async function in a span.bind_trace(sample): ensure a sample already has a trace carrier before passing it across helpers or tasks.
trace_span vs trace_function#
Use trace_span(...) when you only want to trace part of a function body, or when you need to update end-of-span attrs from inside the block.
Use trace_function(...) when the whole function should be represented as one span. Internally it resolves the trace target and then opens a trace_span(...) around the function call, so it works for both sync and async functions.
The decorator is what slime uses for the main rollout pipeline. For example, generate_and_rm(...) is traced per sample and generate_and_rm_group(...) is traced per sample group:
from slime.utils.trace_utils import trace_function


@trace_function("generate_and_rm", target="sample")
async def generate_and_rm(args, sample, sampling_params, evaluation=False):
    ...


@trace_function(
    "generate_and_rm_group",
    target="group",
    attrs_getter=lambda args, group, sampling_params, evaluation=False: {"group_size": len(group)},
)
async def generate_and_rm_group(args, group, sampling_params, evaluation=False):
    ...
Choosing a target#
trace_function(...) needs a trace target, usually a Sample, TraceHandle, or a list of them.
Prefer
target="sample"ortarget="group"when the target is already one of the function arguments.Use
target_getter=...when the trace target has to be derived from arguments.Avoid relying on automatic inference unless the function signature is simple. The implementation can infer a target from arguments or the current trace context, but explicit targets are more stable and avoid ambiguous traces.
Recording attrs on decorated functions#
If you want to attach attributes at span start, use attrs_getter=...:
@trace_function(
    "custom_rollout_batch",
    target="samples",
    attrs_getter=lambda samples, **_: {"batch_size": len(samples)},
)
async def custom_rollout_batch(samples, **kwargs):
    ...
If you need to add attrs after part of the function has executed, use an inner trace_span(...) instead of only relying on the decorator. A common pattern is:
trace_function(...)for the outer function-level lifecycle spannested
trace_span(...)for important sub-steps such as generation, RM, filtering, or post-processing
If you want to record SGLang generation metadata in a consistent way, reuse build_sglang_meta_trace_attrs:
from slime.utils.trace_utils import build_sglang_meta_trace_attrs, trace_span

with trace_span(sample, "sglang_generate") as span:
    output = await post(url, payload)
    span.update(build_sglang_meta_trace_attrs(output["meta_info"]))
Tips#
Save a small number of rollouts first; the viewer is easiest to read when each dump contains a manageable number of samples.
The viewer is built from the saved
.ptdump, so traces can be inspected offline on another machine.For GPU/kernel-level SGLang profiling traces, see Profiling.